Troubleshooting and Optimizing Dask Resources
Overview
Debugging and optimizing performance for distributed systems can be more difficult than on a single machine. In this article we provide some tips for troubleshooting Dask work on a cluster, as well as ways to tweak settings for better performance.
Best practices
To ensure your Dask code is running as fast as possible, reference these best practices for various Dask libraries in the official Dask documentation:
Note that your workload likely involves multiple Dask libraries. So if you are doing distributed machine learning model training, you may also want to refer to the best practices for Arrays or DataFrames depending on how you loaded your data.
Troubleshooting a Dask Cluster
Logs
When migrating a workload a single-machine to run on a Dask cluster, you might notice that logs you used to see printed out in the Jupyter notebook no longer appear. This probably means that the logs are now going to the Dask workers. For more information about logging with a Dask cluster, check out the “Logging in Dask” page.
Restart the Workers
As you use a Dask cluster, some objects may not be cleared from memory when your code stops running. These memory leaks can be from Dask itself or from any libraries (like pandas) that your Dask code uses, and can be very difficult to track down.
To guarantee a clean environment on all workers, you can run the code below.
client.restart()
This function will restart each of the worker processes, clearing out anything they’re holding in memory. This function does NOT restart the actual machines of your cluster, so it runs very quickly.
Dask Cluster Settings
Tweaking cluster settings can have a big impact on the runtime of your workloads. Many times this means using larger workers or more workers, but there are also other settings related to how Dask distributes work. See “Create a Dask Cluster in the UI”) for how to create a Dask cluster and edit these settings.
If you encounter any of the following, you may need to optimize your cluster settings:
- Memory-related errors
- If you use multiple workers but they aren’t all running at high utilization
- If you find you have specific steps bottlenecking your jobs
- If your data is “reshuffling” a lot across the workers in your cluster
Increase the Worker Size
When the work you ask a cluster to do requires most of the cluster’s memory, Dask will start spilling objects to disk. This happens automatically. This is great because it means that jobs that require a little more memory than you expected won’t be killed by out-of-memory errors, but once you start spilling to disk you should expect your code to get significantly slower.
From the official Dask documentation:
- At 60% of memory load (as estimated by sizeof), spill least recently used data to disk.
- At 80% of memory load, stop accepting new work on local thread pool
- At 95% of memory load, terminate and restart the worker
Watch the Dask dashboard closely. If the worker memory gets close to 60%, that might mean that Dask has started to spill to disk. In this situation, the easiest solution is to resize the cluster by increasing the worker size.
Add More Workers
If training is hitting memory issues (see “Increase the Worker Size”) or you just want to try throwing more CPU at the problem, increase the number of workers in the cluster. All else equal, you should expect that for many distributed training algorithms, doubling the number of workers cuts the training time in slightly-less-than-half. This effect has limits, since adding more workers adds more communication overhead, but it’s a good thing to try.
Increase the Scheduler Size
The Dask scheduler is in charge of making sure tasks get distributed to the workers, but sometimes the scheduler may be bottlenecked as well. To monitor the state of the scheduler, click the “System” tab from the Dask dashboard:
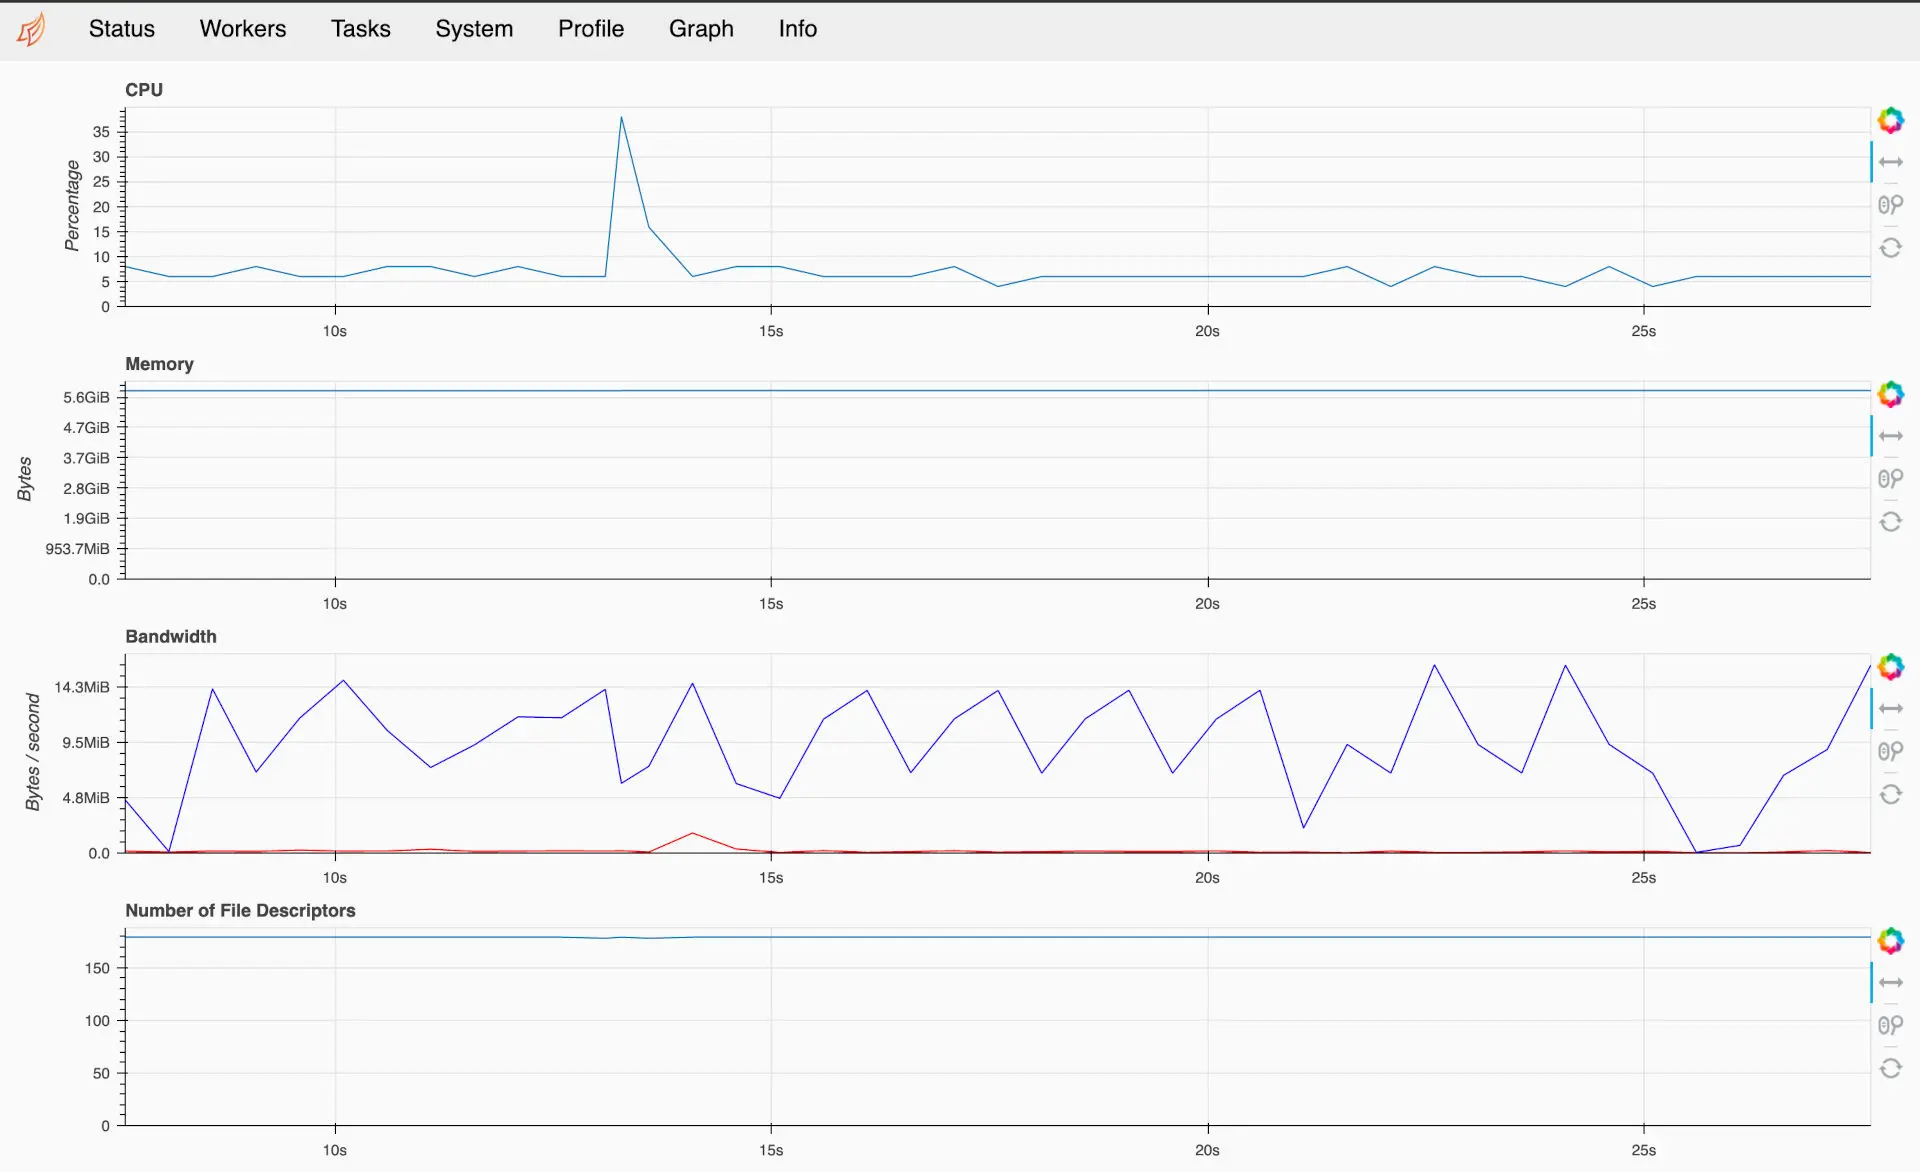
If the CPU is running high, you may have a lot of small tasks that are causing strain on the scheduler. Some Dask operations require sending data through the scheduler to the workers, so if that data is large the scheduler may also eat up a lot of memory. You typically want at least a “Large” instance for a scheduler, but if you have a heavy-duty workload you may require using the same size machine as your workers.
Number of Workers Processes/Threads
By default, Dask clusters in Saturn Cloud set nthreads to be the same as the number of logical CPUs on each worker machine. This is usually the right choice for ensuring that all CPUs in a cluster are being utilized to perform Dask work. If you notice that work is running slow on your cluster, you may want to double-check that nthreads is indeed set to the number of CPUs of each worker.
There are some scenarios where it may be useful to also set nprocs. For more information about choosing between processes and threads, check out this Dask documentation page. Note that the page is discussing a single-machine scheduler (we’re using dask.distributed with Saturn Cloud), but the information about which workloads benefit from threads or processes is useful.
